Authors: Dr Marija Vukoja, Dr Monika Franczuk and Dr Jana Kivastik
Overview
This section provides a step-by-step guidance for spirometry interpretation. It is based on the latest 2022 update of ATS/ERS 2005 recommendations on the standardization of pulmonary function tests [1]. Special attention is given to selection of appropriate reference equations and use of lower limit of normal (LLN) and z-scores instead of widely used percent predicted values when identifying and assessing severity of lung function impairment.
Aims
- Compare test results with reference values
- Indicate limitations of reference values
- Indicate errors of using the percentage predicted and the advantages of using the lower limit of normal and z-scores
- Recognise the normal, obstructive, restrictive, mixed and upper airway obstruction pattern in the flow-volume curve
- Recognise lung function abnormalities by using LLN and z-scores
- Assess severity of lung function impairment
- Interpret bronchodilator responsiveness testing
- Evaluate change of spirometry testing overtime in individual patients
Spirometry interpretation checklist
- Select appropriate reference equations
- Make sure your spirometry tests are of good quality
- Examine the flow-volume curve pattern (i.e. normal, obstruction, restriction, upper airway obstruction)
- Check if FEV1/FVC >5th percentile
- Check if FVC>5th percentile
- Classify severity of lung function impairment by using z scores
- Summarise the test results
- Refer for further testing if needed (i.e., measurements of lung volumes in restrictive or mixed pattern)
Video 1: Interpretation of spirometry results (case study)
Video 2: Interpretation of spirometry results
Interpretation of spirometry results should be based on the recent ERS/ATS technical standard on interpretive strategies for routine lung function tests [1]. Considering within-person biological variability and uncertainty of the test, especially when results lie close to the somewhat arbitrary cut offs between health and suspected disease spirometry interpretation must always be complemented with clinical expertise and spirometry alone should not be used to diagnose a specific pathological condition.
The importance of quality control
Poorly performed spirometry greatly increases the risk of misinterpreting spirometry results. The spirometry interpretation should therefore begin with the assessment of quality using A, B, C, D, E, U, F grading system [2]. This grading system informs the interpreter about the confidence level that the spirometry results represent the patient's best effort. Interpretation of spirometry in which grades are less than A is less reliable and is highly dependent on clinical judgment.
Choosing the reference values
When interpreting lung function, obtained values are compared to normal values that are ideally based on a large sample of healthy adults with similar characteristics to the population being measured. PFT technologists and physicians should be aware which reference equations they are using for spirometry interpretation, and the source of these reference equations should be clearly stated in the report.
Global Lung Initiative (GLI) 2022 race-neutral reference equations currently provide the most reliable spirometric prediction equations for the 3-95-year age range, and are recommended by ATS & ERS [3]. These reference equations are derived from the largest sample of healthy individuals and account for the non-linear relationship between spirometric indices and age and height.
Assessing normality
In clinical medicine, the normal range for a given test is based on the results that are seen in 95% of the healthy population, which in the case of normal distribution lies between mean value ±2SD. Traditionally normal lung function values are defined as 80-120% and calculated as mean value (100% predicted), with assumed SD of 10%. This approach is an oversimplification because the lung function variability is not constant across all age ranges and leads to misinterpretation of lung function, especially in young and elderly. A more accurate approach is to calculate the lower limit of normal (LLN). Since for spirometry, only low values are considered abnormal LLN is taken to be equal to the 5th percentile of a healthy population (corresponding to a z-score of -1.64). The z-score shows how many SD is the observed value away from the mean value and is obtained using the following equation:
Z-scores lower than -1.64 (LLN<5th percentile) indicate an abnormality. When interpreting the results, it is important to consider that statistically there is a 5% chance that a healthy individual may have results below the LLN, so the results should always be interpreted in a clinical context, especially when the values lie close to LLN.
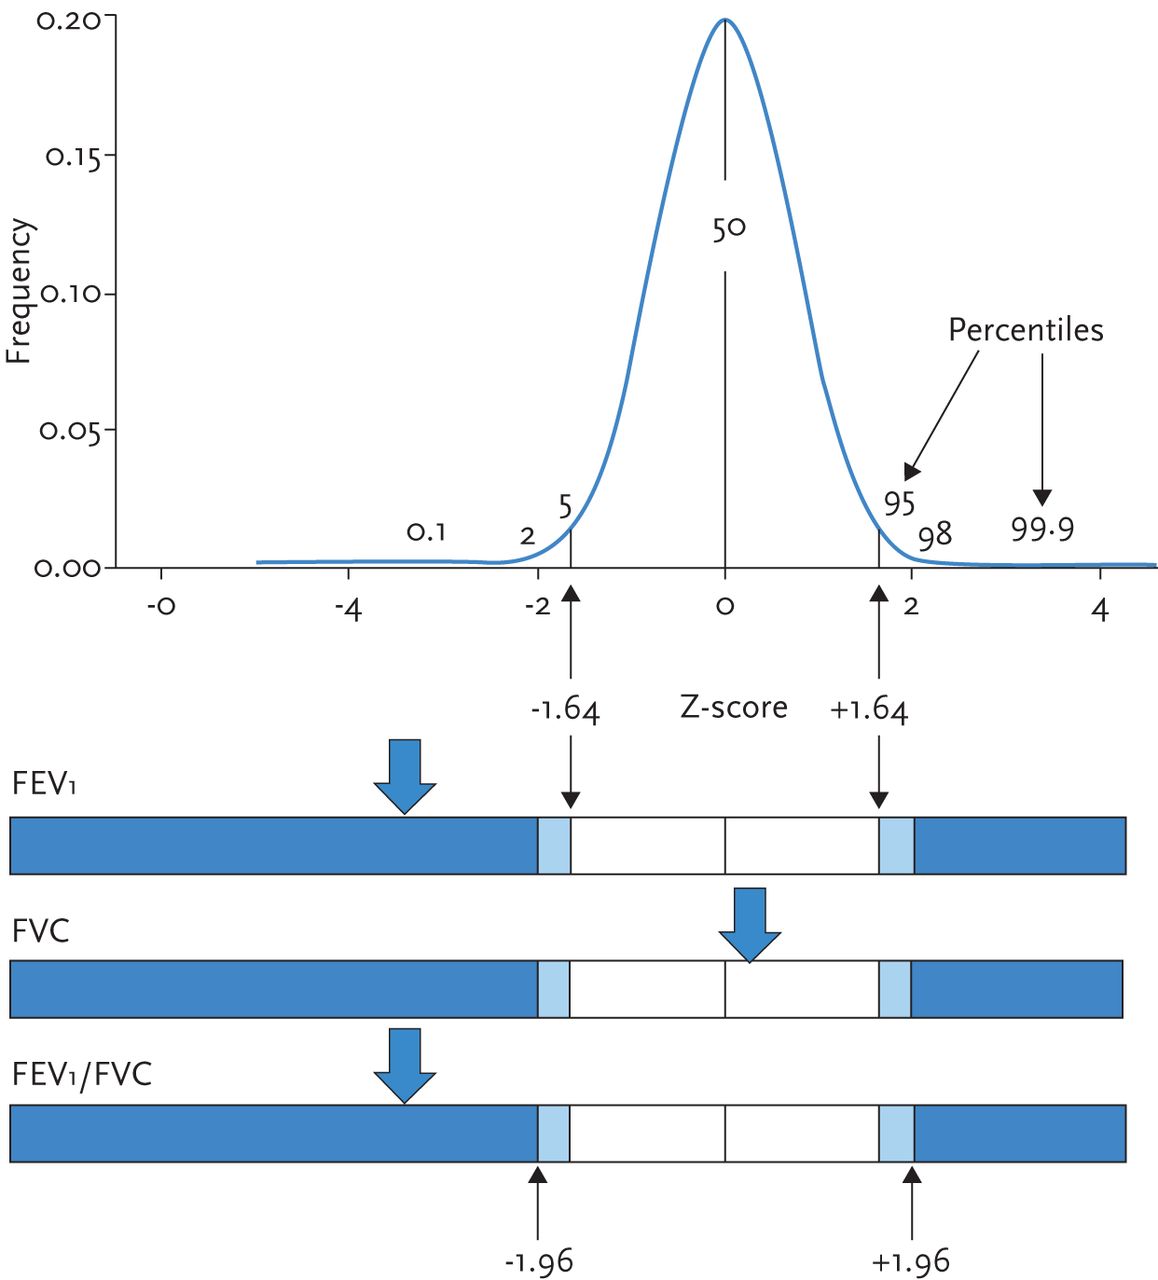
Figure 1: Illustration of the normal distribution and corresponding Z-scores and percentiles.
The pictogram (horizontal bars) demonstrates the normal range (white region) with arrows indicating how far from the normal range an observation is (Z-scores). The 50th centile (0 Z-scores) is equivalent to 100% predicted [4, 5].
Why use LLN instead of fixed ratio of FEV1/FVC to diagnose airway obstruction?
The GOLD committee recommends FEV1/FVC < 0.7 (after bronchodilation) as cut-off value for airway obstruction. FEV1/FVC ratio declines with increasing age and height, even in healthy lifelong non-smokers, in whom the LLN drops below a ratio of 0.7 after about 45 years of age. Thus the use of fixed ratio to diagnose airway obstruction is imprecise and causes over-diagnosis in elderly and under-diagnosis in younger patients (as seen in the figure below). Therefore FEV1/FVC<5th percentile (LLN) should be used to define obstruction on spirometry.
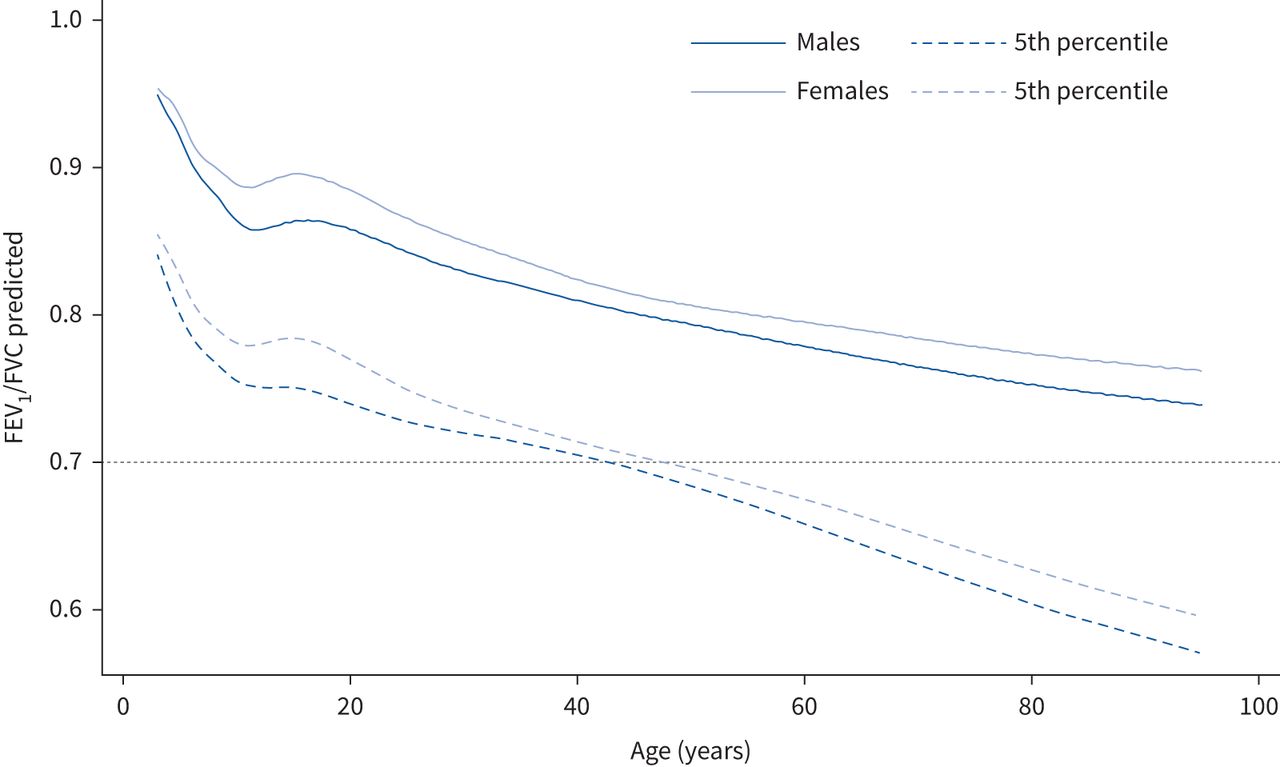
Figure 2: Forced expiratory volume in 1 s(FEV1)/forced vital capacity (FVC) predicted and lower limits of normal (5th percentile) compared with the fixed cut-off of 0.7.
Assessing the flow-volume curve configuration
The configuration of the flow-volume curve of a properly performed spirometry test should be used to identify typical spirometry patterns: normal, obstructive, restrictive, mixed, variable intra or extrathoracic obstruction and fixed central airway obstruction.
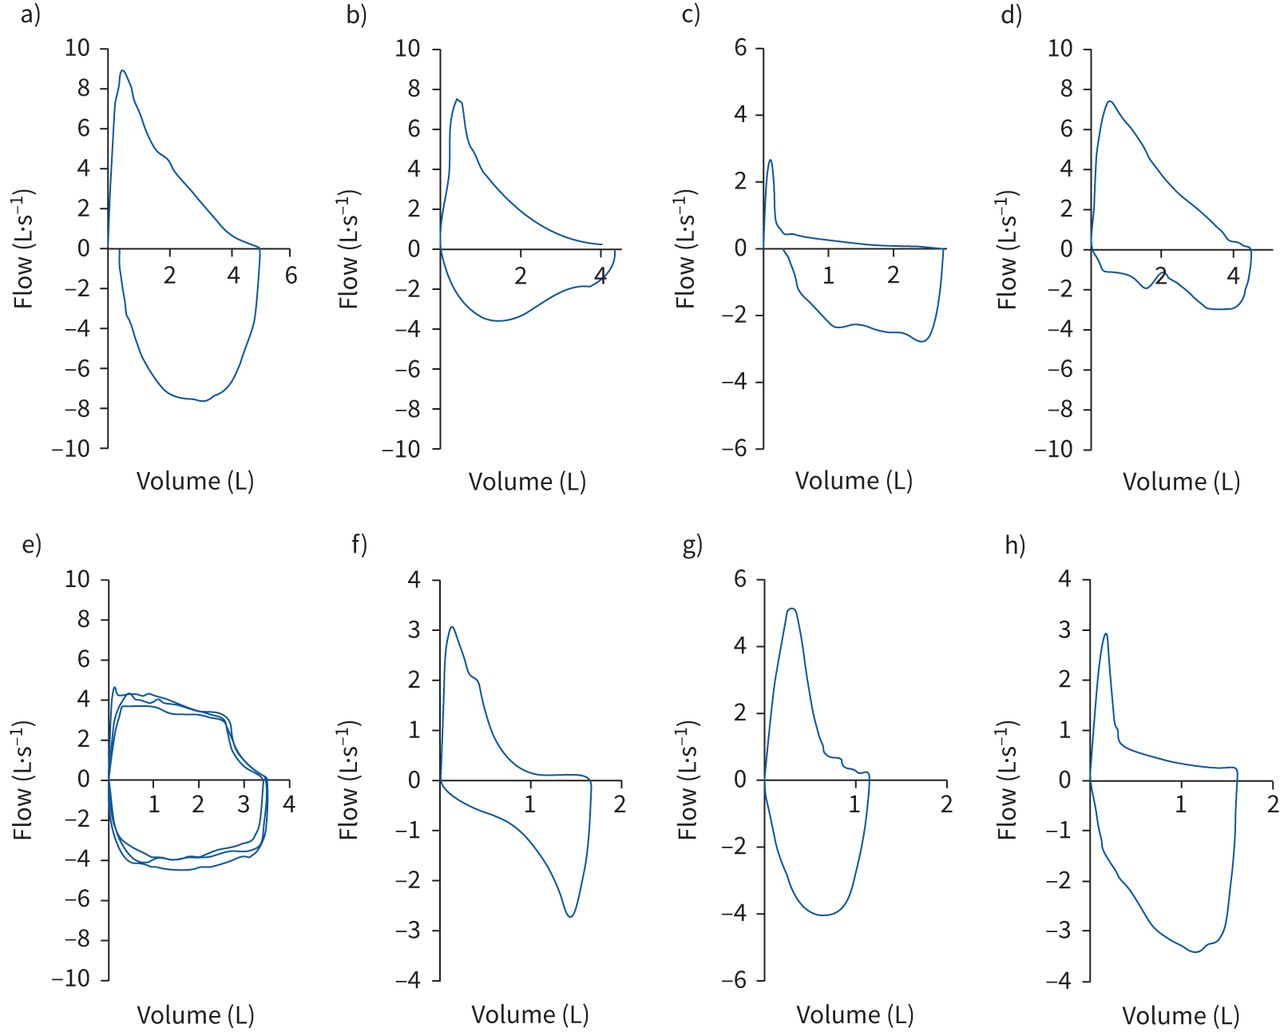
Figure 3: Examples of typical flow-volume loop configurations for a) normal, b) mild-moderate obstruction, c) severe obstruction, d) variable extrathoracic obstruction, e) fixed large/central airway obstruction, f) unilateral mainstem bronchial obstruction, g) restriction and h) mixed disorder [1].
Classification of ventilatory impairment
Flowchart showing the general approach to interpretation of spirometry based on LLN (5th percentile):
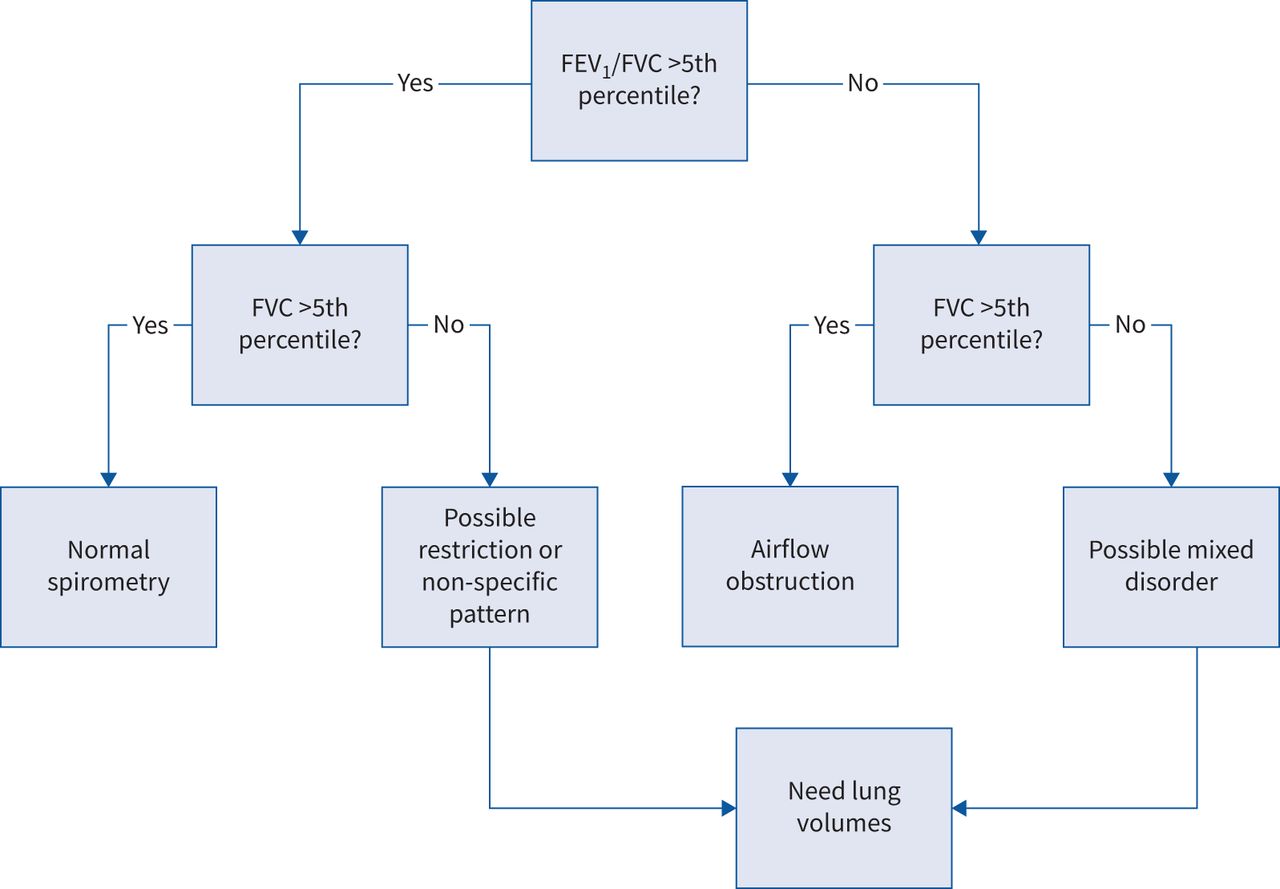
Figure 4: Approach to interpretation of spirometry [1].
Beginning with the forced expiratory volume in 1s (FEV1)/forced vital capacity (FVC) ratio, determine whether obstruction is present based on whether the ratio is low (right side of figure). If obstruction is present, then assess the FVC to determine whether there is simply obstruction or whether there may be concomitant restriction ("mixed disorder").
Measurement of total lung capacity (TLC) will define restriction, so if TLC is normal, then there is only obstruction, but if TLC is low, then there is concomitant restriction. If FEV1/FVC is normal, signifying no obstruction (left side of figure), then once again assess FVC. If FVC is normal, then spirometry is normal, but if FVC is low, then there may be possible restriction. This must be determined by measurement of TLC. If TLC is low, then spirometry is consistent with restriction. If restriction is ruled out by a normal TLC, then the pattern of impairment of low FVC with normal FEV1/FVC has been termed the possible restriction or "non-specific" pattern, which may include diseases causing obstruction or restriction. Restriction presenting as the non-specific pattern is often caused by a chest wall or neuromuscular disorder [1].
More detailed classification of ventilatory impairment defined by spirometry based on lower (LLN, 5th percentile) and upper (ULN) limits of normal:
| FEV1 | FVC | FEV1/FVC | Comment | |
| Obstructive impairment | Normal/↓ | Normal | ↓ | |
| Restrictive impairment | ↓ | ↓ | Normal/↑ | TLC reduced to confirm |
| Non-specific pattern | ↓ | ↓ | Normal | TLC normal (additional testing may be helpful, e.g. bronchodilator response, Raw); when TLC is not available, this pattern has been described in population-based studies as preserved ratio impaired spirometry (PRISm) in current and former smokers |
| Muscle weakness | ↓ | ↓ | Normal | Lack of sharp PEF |
| Suboptimal effort | ↓ | ↓ | Normal | Lack of sharp PEF |
| Mixed disorder | ↓ | ↓ | ↓ | Need lung volumes to confirm |
| Dysanapsis | Normal | Normal/↑ | ↓ | Maybe normal variant |
FEV1: forced expiratory volume in 1s; FVC: forced vital capacity; TLC: total lung capacity; Raw: airway resistance; PEF: peak expiratory flow.
Table 1: Classification of ventilatory impairments defined by spirometry (reduced or elevated results are defined by the lower and upper limits of normal, respectively) [1]
In central and upper airway obstruction FEV1 and FEV1/FVC may be normal or reduced but PEF is severely reduced (this should be distinguished from poor effort that may also cause low PEF). An FEV1/PEF ratio >8ml/l/min suggests the presence of central or upper airway obstruction. Forced inspiratory flow at 50% FVC (FIF50%) and forced expiratory flow at 50% FVC (FEF50%) may help to distinguish intrathoracic (intrathoracic trachea and main bronchi) from extrathoracic (pharynx, larynx, extrathoracic trachea) airway obstruction.
| | Extrathoracic obstruction | Intrathoracic obstruction | |
| Fixed | Variable | ||
| PEF | Decreased | Normal or decreased | Decreased |
| FIF50% | Decreased | Decreased | Normal or decreased |
| FIF50%/FEF50% | ∼1 | <1 | >1 |
PEF: peak expiratory flow; FIF50%: forced inspiratory flow at 50% FVC; FEF50%: forced expiratory flow at 50% FVC; FVC: forced vital capacity.
Table 2: Lung function indices capable of differentiating extrathoracic from intrathoracic obstruction in adults [1].
Severity of lung function impairment
A three-level system to assess the severity of lung function impairment using z-score values should be used:
| z-score value | Lung function impairment |
| between −1.645 and −2.5 | mild |
| between −2.51 and −4 | moderate |
| less than −4.1 | severe |
Table 3: Three-level system to assess the severity of lung function impairment
This grading system informs about the extent of lung function deviation from what is expected in healthy individuals. The severity of lung function impairment is not necessarily equivalent to disease severity (which is usually a multidimensional measure and may also include symptoms, quality of life, imaging, etc). Also, this grading system should not be applied to patients with upper airway obstruction (i.e. tracheal stenosis) where obstruction could be life-threatening and yet be classified as mild by lung function.
Bronchodilator responsiveness testing
Bronchodilator responsiveness (BDR) testing is used to assess the degree of improvement of airflow in response to administration of a bronchodilator. Previous term reversibility testing is discouraged as reversibility implies complete elimination of bronchial obstruction. In the 2005 ATS/ERS recommendations, an increase of FEV1 or FVC by >200ml and ≥12% from baseline was considered a positive test. This recommendation was made by consensus of expert opinion based on normal statistical variation and is widely accepted by asthma and COPD clinical guidelines. However an absolute and relative changes in FEV1 and FVC are inversely proportional to baseline lung function and are age, sex and height dependant. To minimise sex and size bias, the 2022 ATS/ERS technical standards recommend that BDR is defined as a change >10% relative to the predictive value for FEV1 and FVC calculated as following:
Change in spirometry over time
The annual decline of FEV1 in healthy-non smokers is about 30ml. Traditionally, the FEV1 drop of 100ml or 10% are considered clinically meaningful. As discussed before the absolute and relative change in FEV1 and FVC are prone to sex and height bias. The new recommendations suggest dividing FEV1 by the sex-specific 1st centile values of FEV1 found in adults with lung disease (FEV1Q) for long term monitoring of lung function in adults.
The change score is defined as:

where zFEV1 at t1 and t2 are the observed forced expiratory volume in 1s (FEV1) z-scores at the initial and second time-point, and r is defined as 0.642-0.04×time (years)+0.020×age (years) at t1. Changes within ±1.96 change scores are considered within the normal limits [1].
1. ERS/ATS technical standard on interpretive strategies for routine lung function tests. Sanja Stanojevic et al. European Respiratory Journal (2022). 60: 2101499; DOI: 10.1183/13993003.01499-2021
2. Standardization of Spirometry 2019 Update An Official American Thoracic Society and European Respiratory Society Technical Statement. Brian L. Graham et al. Am J Respir Crit Care Med (2019). 200:e7
3. A Race-neutral Approach to the Interpretation of Lung Function Measurements. Cole Bowerman et al. American journal of respiratory and critical care medicine vol. 207,6 (2023): 768-774. DOI:10.1164/
4. Multi-ethnic reference values for spirometry for the 3-95-yr age range: the global lung function 2012 equations. Philip H Quanjer et al. The European respiratory journal vol. 40,6 (2012): 1324-43;
5. The Global Lung Function Initiative: dispelling some myths of lung function test interpretation. Sanja Stanojevic et al. Breathe (2013) 9: 462-474; DOI: 10.1183/20734735.012113